firing and sends notifications through the attached contact points.
You need at least one contact point before creating an alert rule. Set one up first if you haven’t already.
Create an alert rule
1
Navigate to Alert Rules
In the sidebar, go to Alerting. You’ll see all alerts across your deployments. Click Add Alert to create a new rule.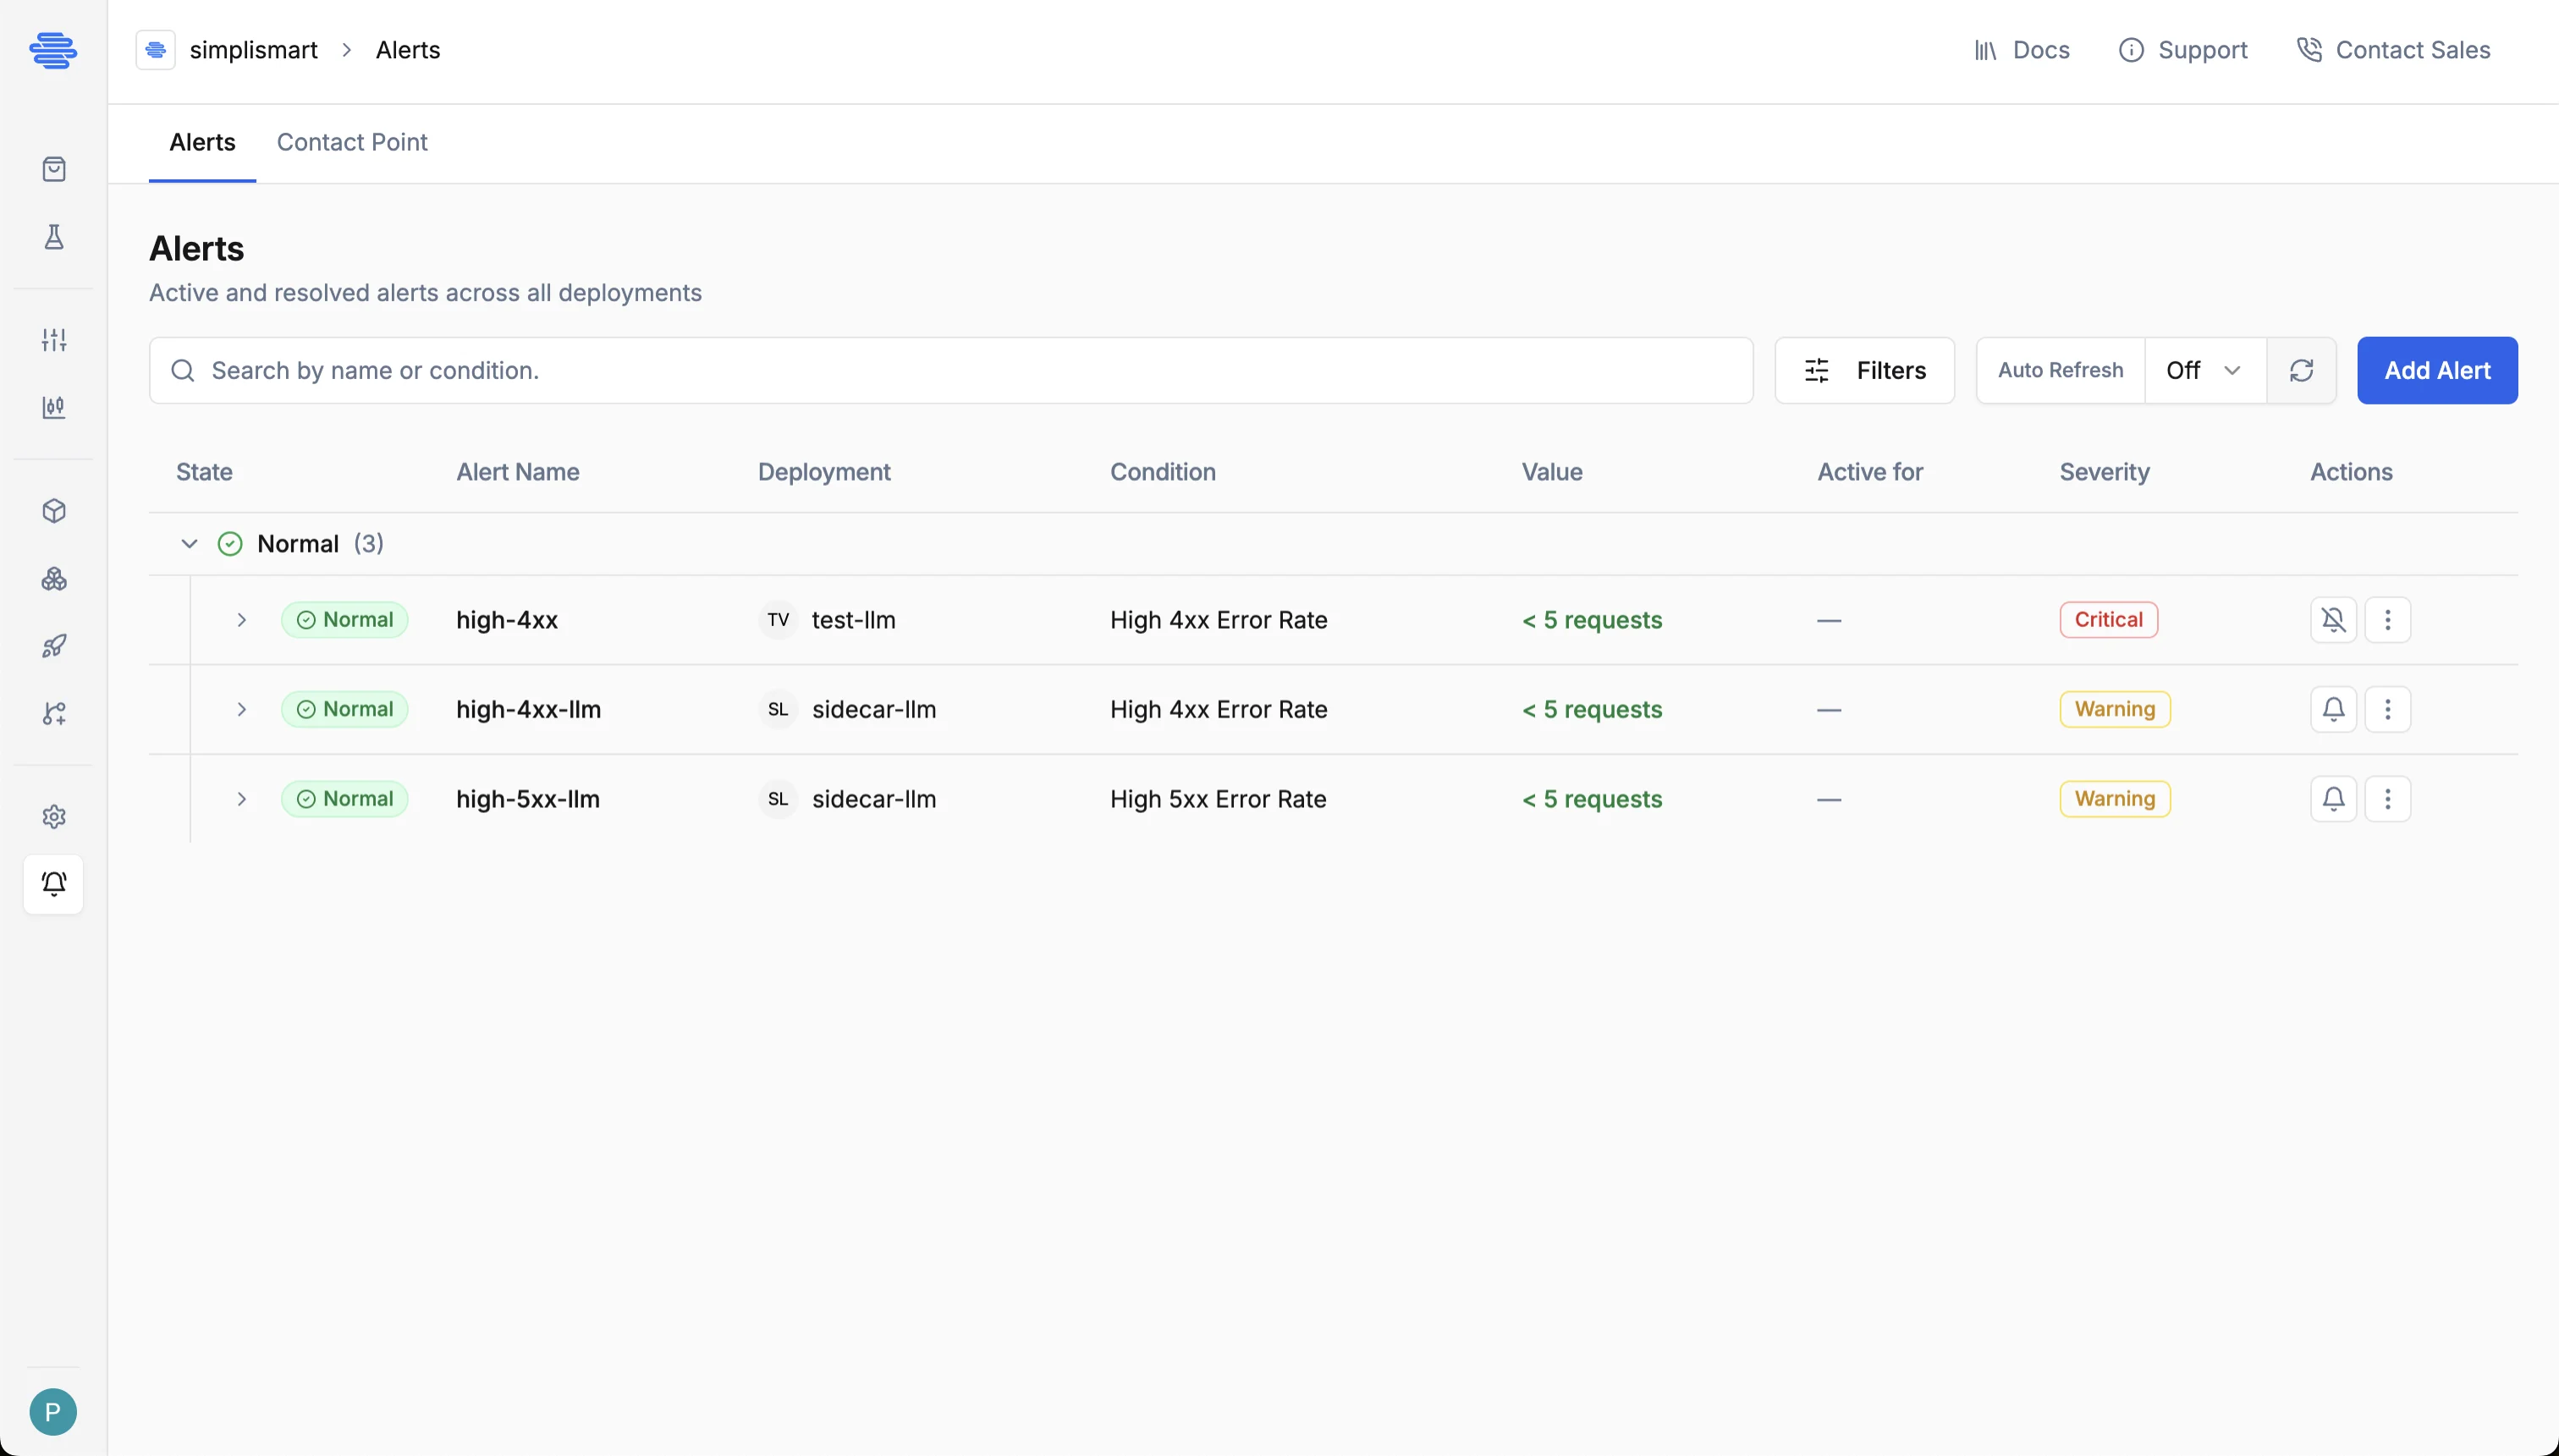
2
Fill in Meta Data
Provide a Name for the alert rule. Optionally add Tags (up to 60 characters each) to help categorise and filter rules, and a Description for additional context.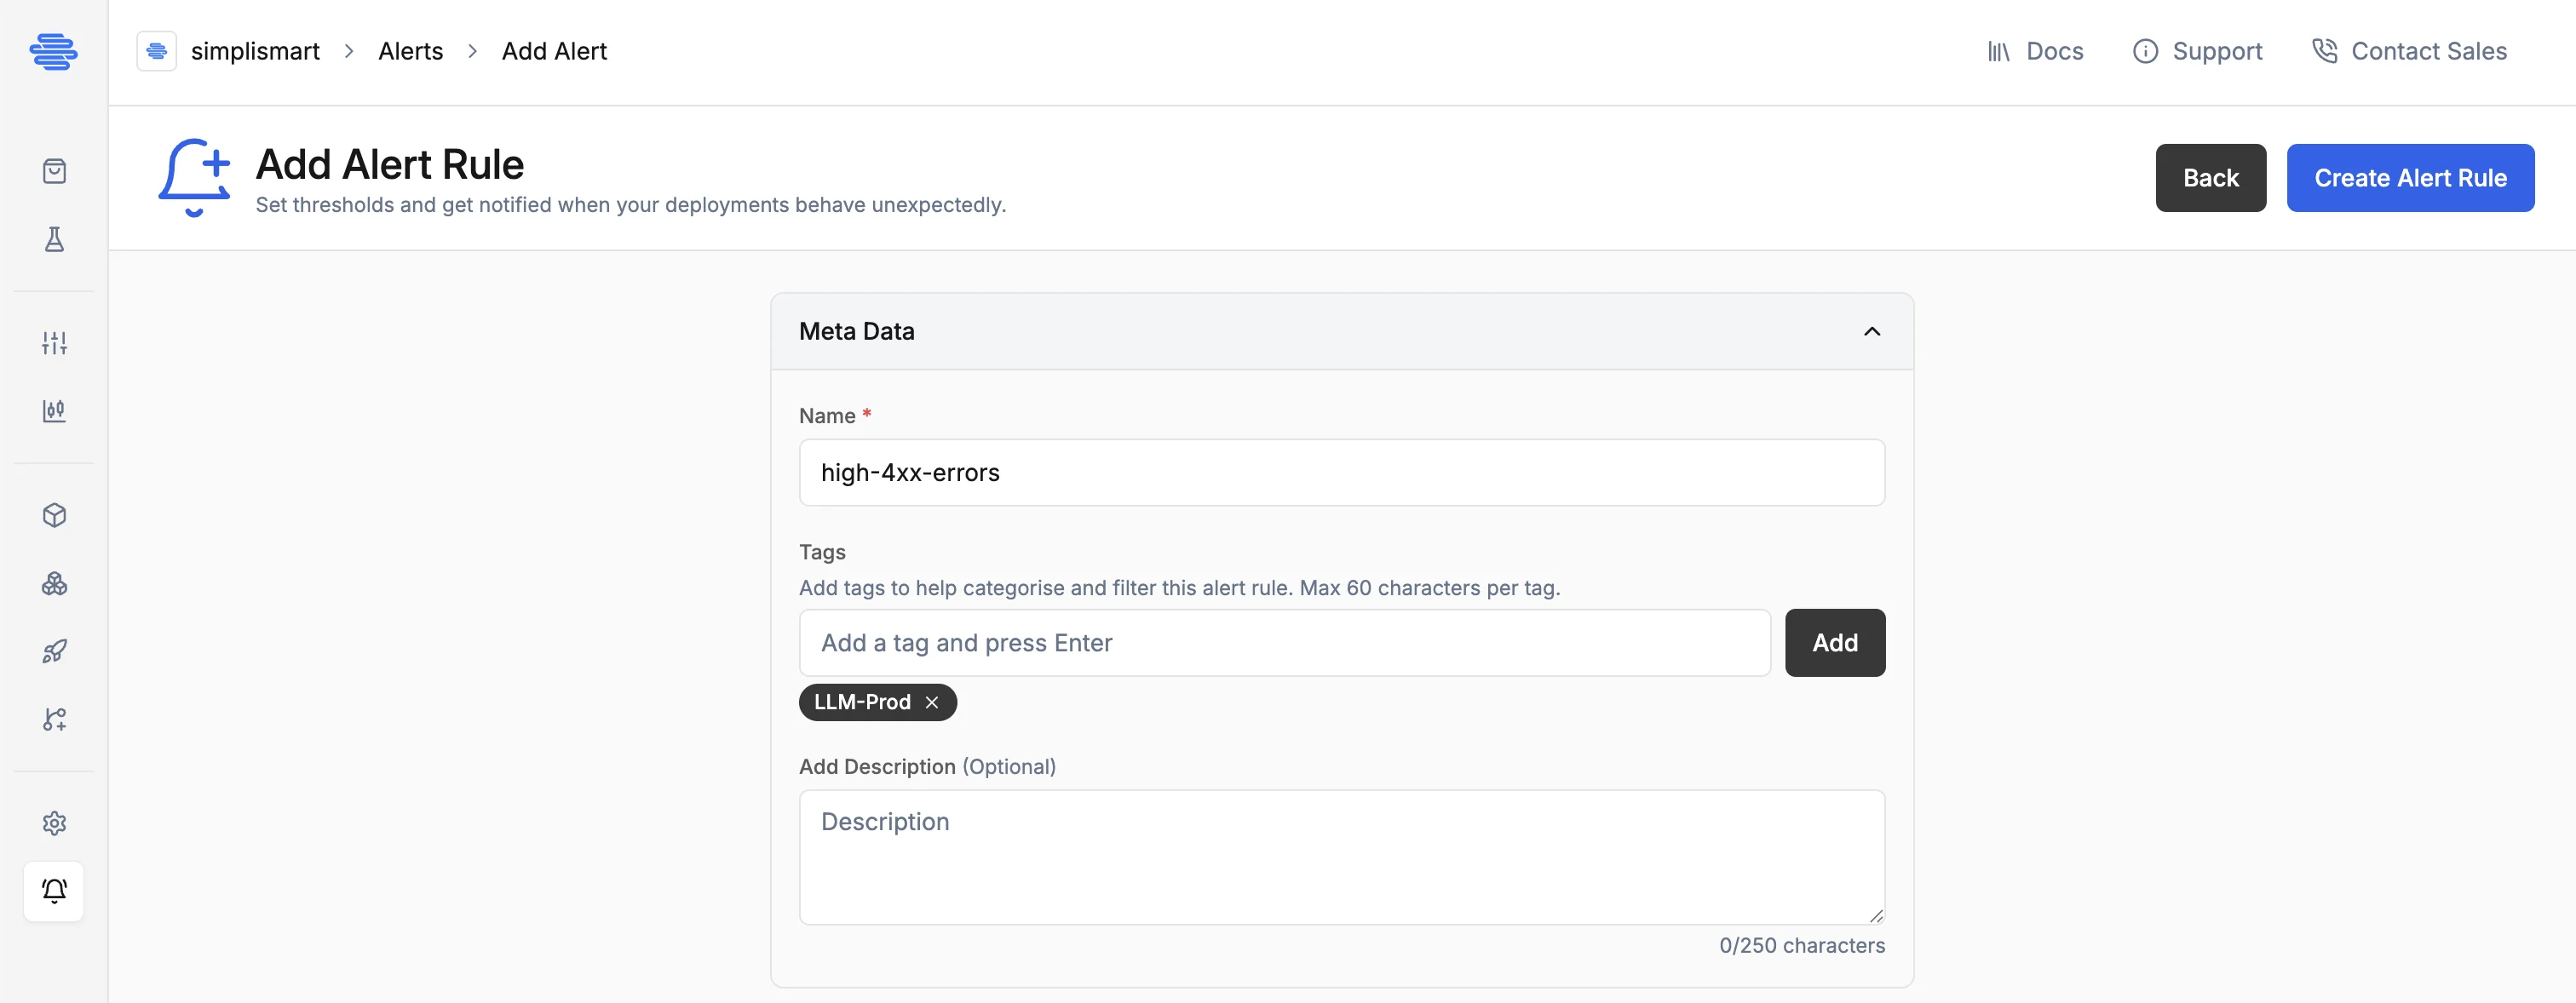
3
Select a deployment
In the Resource Details section, the Type is set to Deployment. Use the Resource Name dropdown to search for and select the deployment you want to monitor.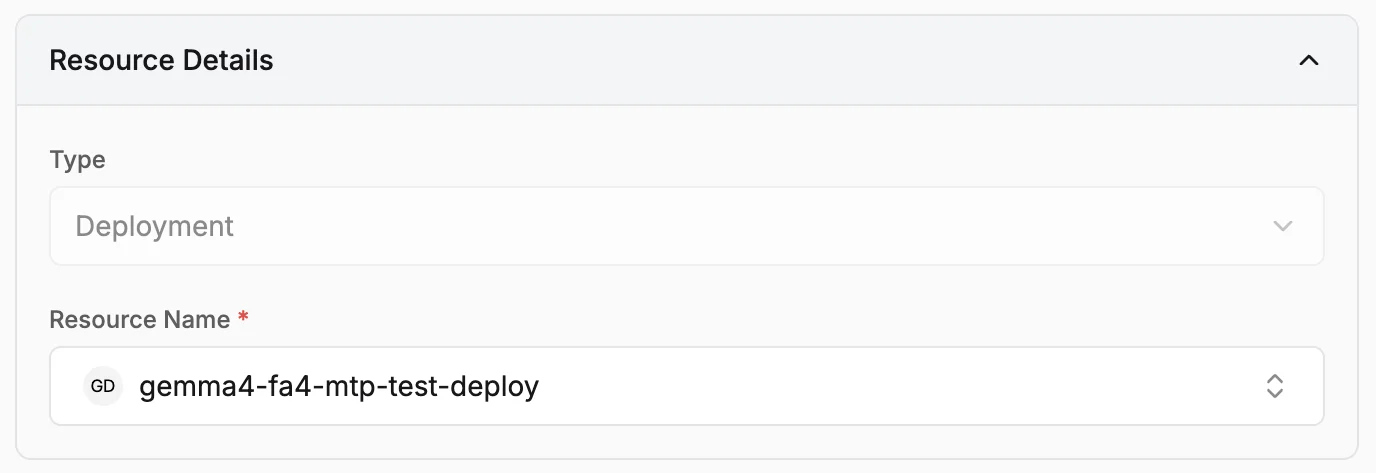
4
Configure Alert Condition Setup
In the Alert Condition Setup section:
- Condition: Select a monitoring condition (e.g., High 4xx Error Rate). The available conditions are filtered by your deployment’s model type.
- Parameters: Fill in the condition’s parameters such as thresholds, exclusion patterns, and evaluation window. Each field shows its unit, valid range, and a description.
- Severity: Choose Critical (immediate attention required) or Warning (needs monitoring).
- Contact Point: Select the contact points to notify when this rule fires. At least one contact point is required to activate the alert; you can add up to 5.
-
Evaluate every: How often Grafana evaluates the rule (e.g.,
5m). -
Pending Period: How long the condition must be continuously true before the alert transitions from
pendingtofiring. Use this to suppress noise from transient spikes.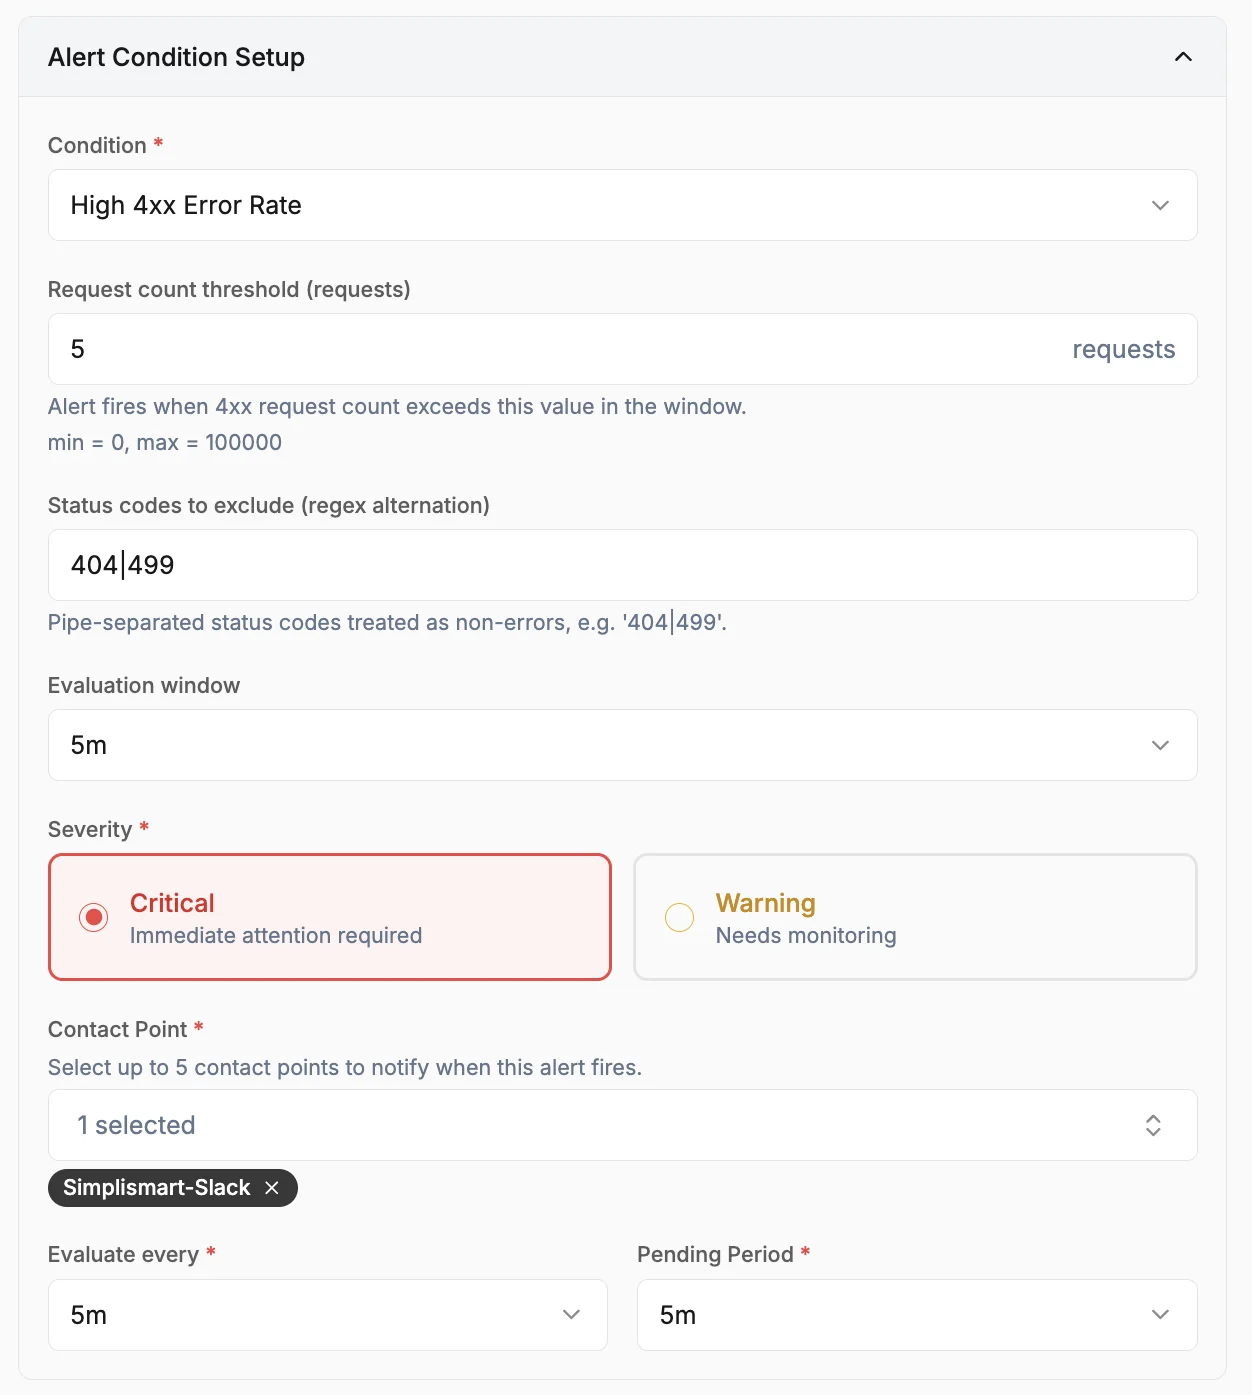
5
Create the alert rule
Click Create Alert Rule. The rule is provisioned in Grafana and begins evaluating on the next interval.
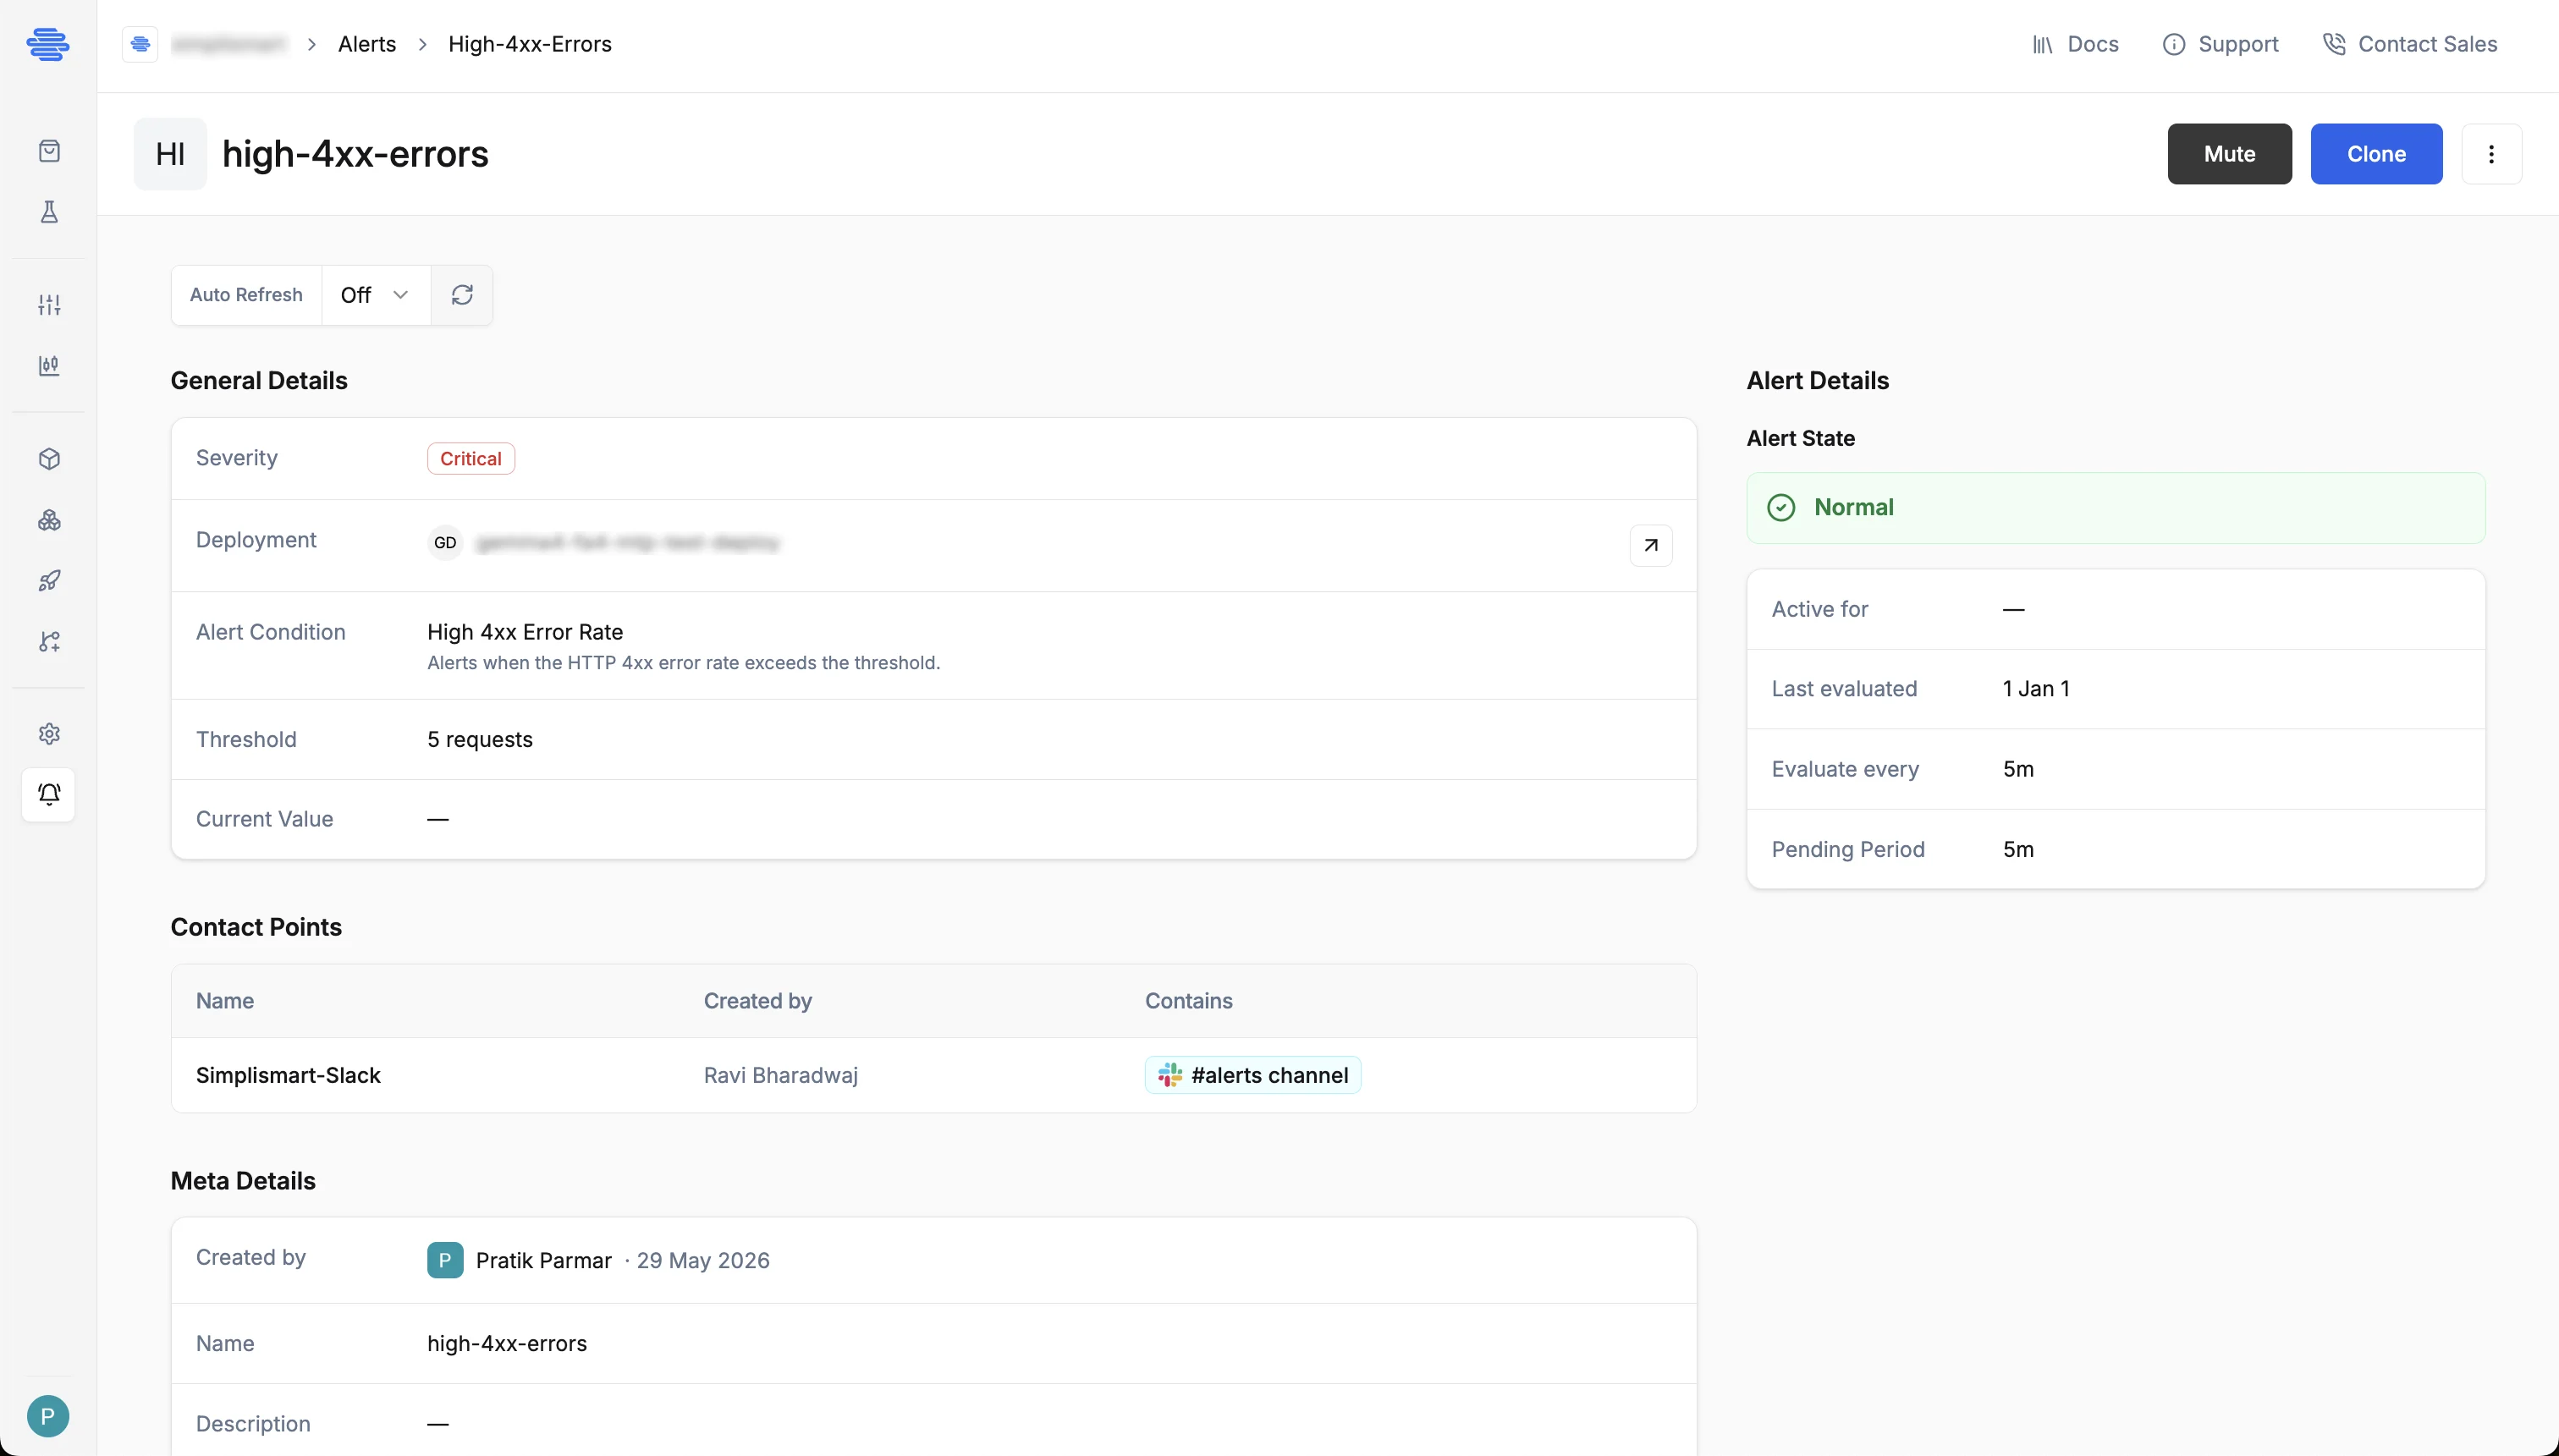
Alert Details Page
Click any alert rule in the list to open its detail page. The page shows:- General Details: Severity, deployment, alert condition, threshold, and current value
- Contact Points: The notification channels attached to this rule.
- Meta Details: Creator, name, and description
- Alert State panel: Current state, last evaluation time, evaluation interval, and pending period