Documentation home page
Search...
⌘K
Ask AI
Support
Sign Up
Sign Up
Search...
Navigation
Deployment
Inference & Monitoring
Documentation
API Reference
Guides
FAQ
Configuration References
Blog
Get Started
Overview
Quickstart
Types of Inference
Shared Endpoint
Private Endpoint
BYOC
Playground
Large Language Models
Transcription Models
Image Generation Models
Model Compilation
Optimise a Model
Adding a Custom Model
Deployment
Creating a Deployment
Deploying a Custom Model
Deploy on an Imported Cluster
Inference & Monitoring
Benchmarking
Deploying NIM
Training
Introduction
LLM/VLM (New)
LLM/VLM (Legacy)
Flux
Deploy Fine-Tuned model
Settings
General Settings
Your Organisation
API Keys
Usage
Billing
References
Terminology Guide
On this page
Steps for Using the Deployed Model and Monitoring it’s Performance
Deployment
Inference & Monitoring
Steps for Using the Deployed Model and Monitoring it’s Performance
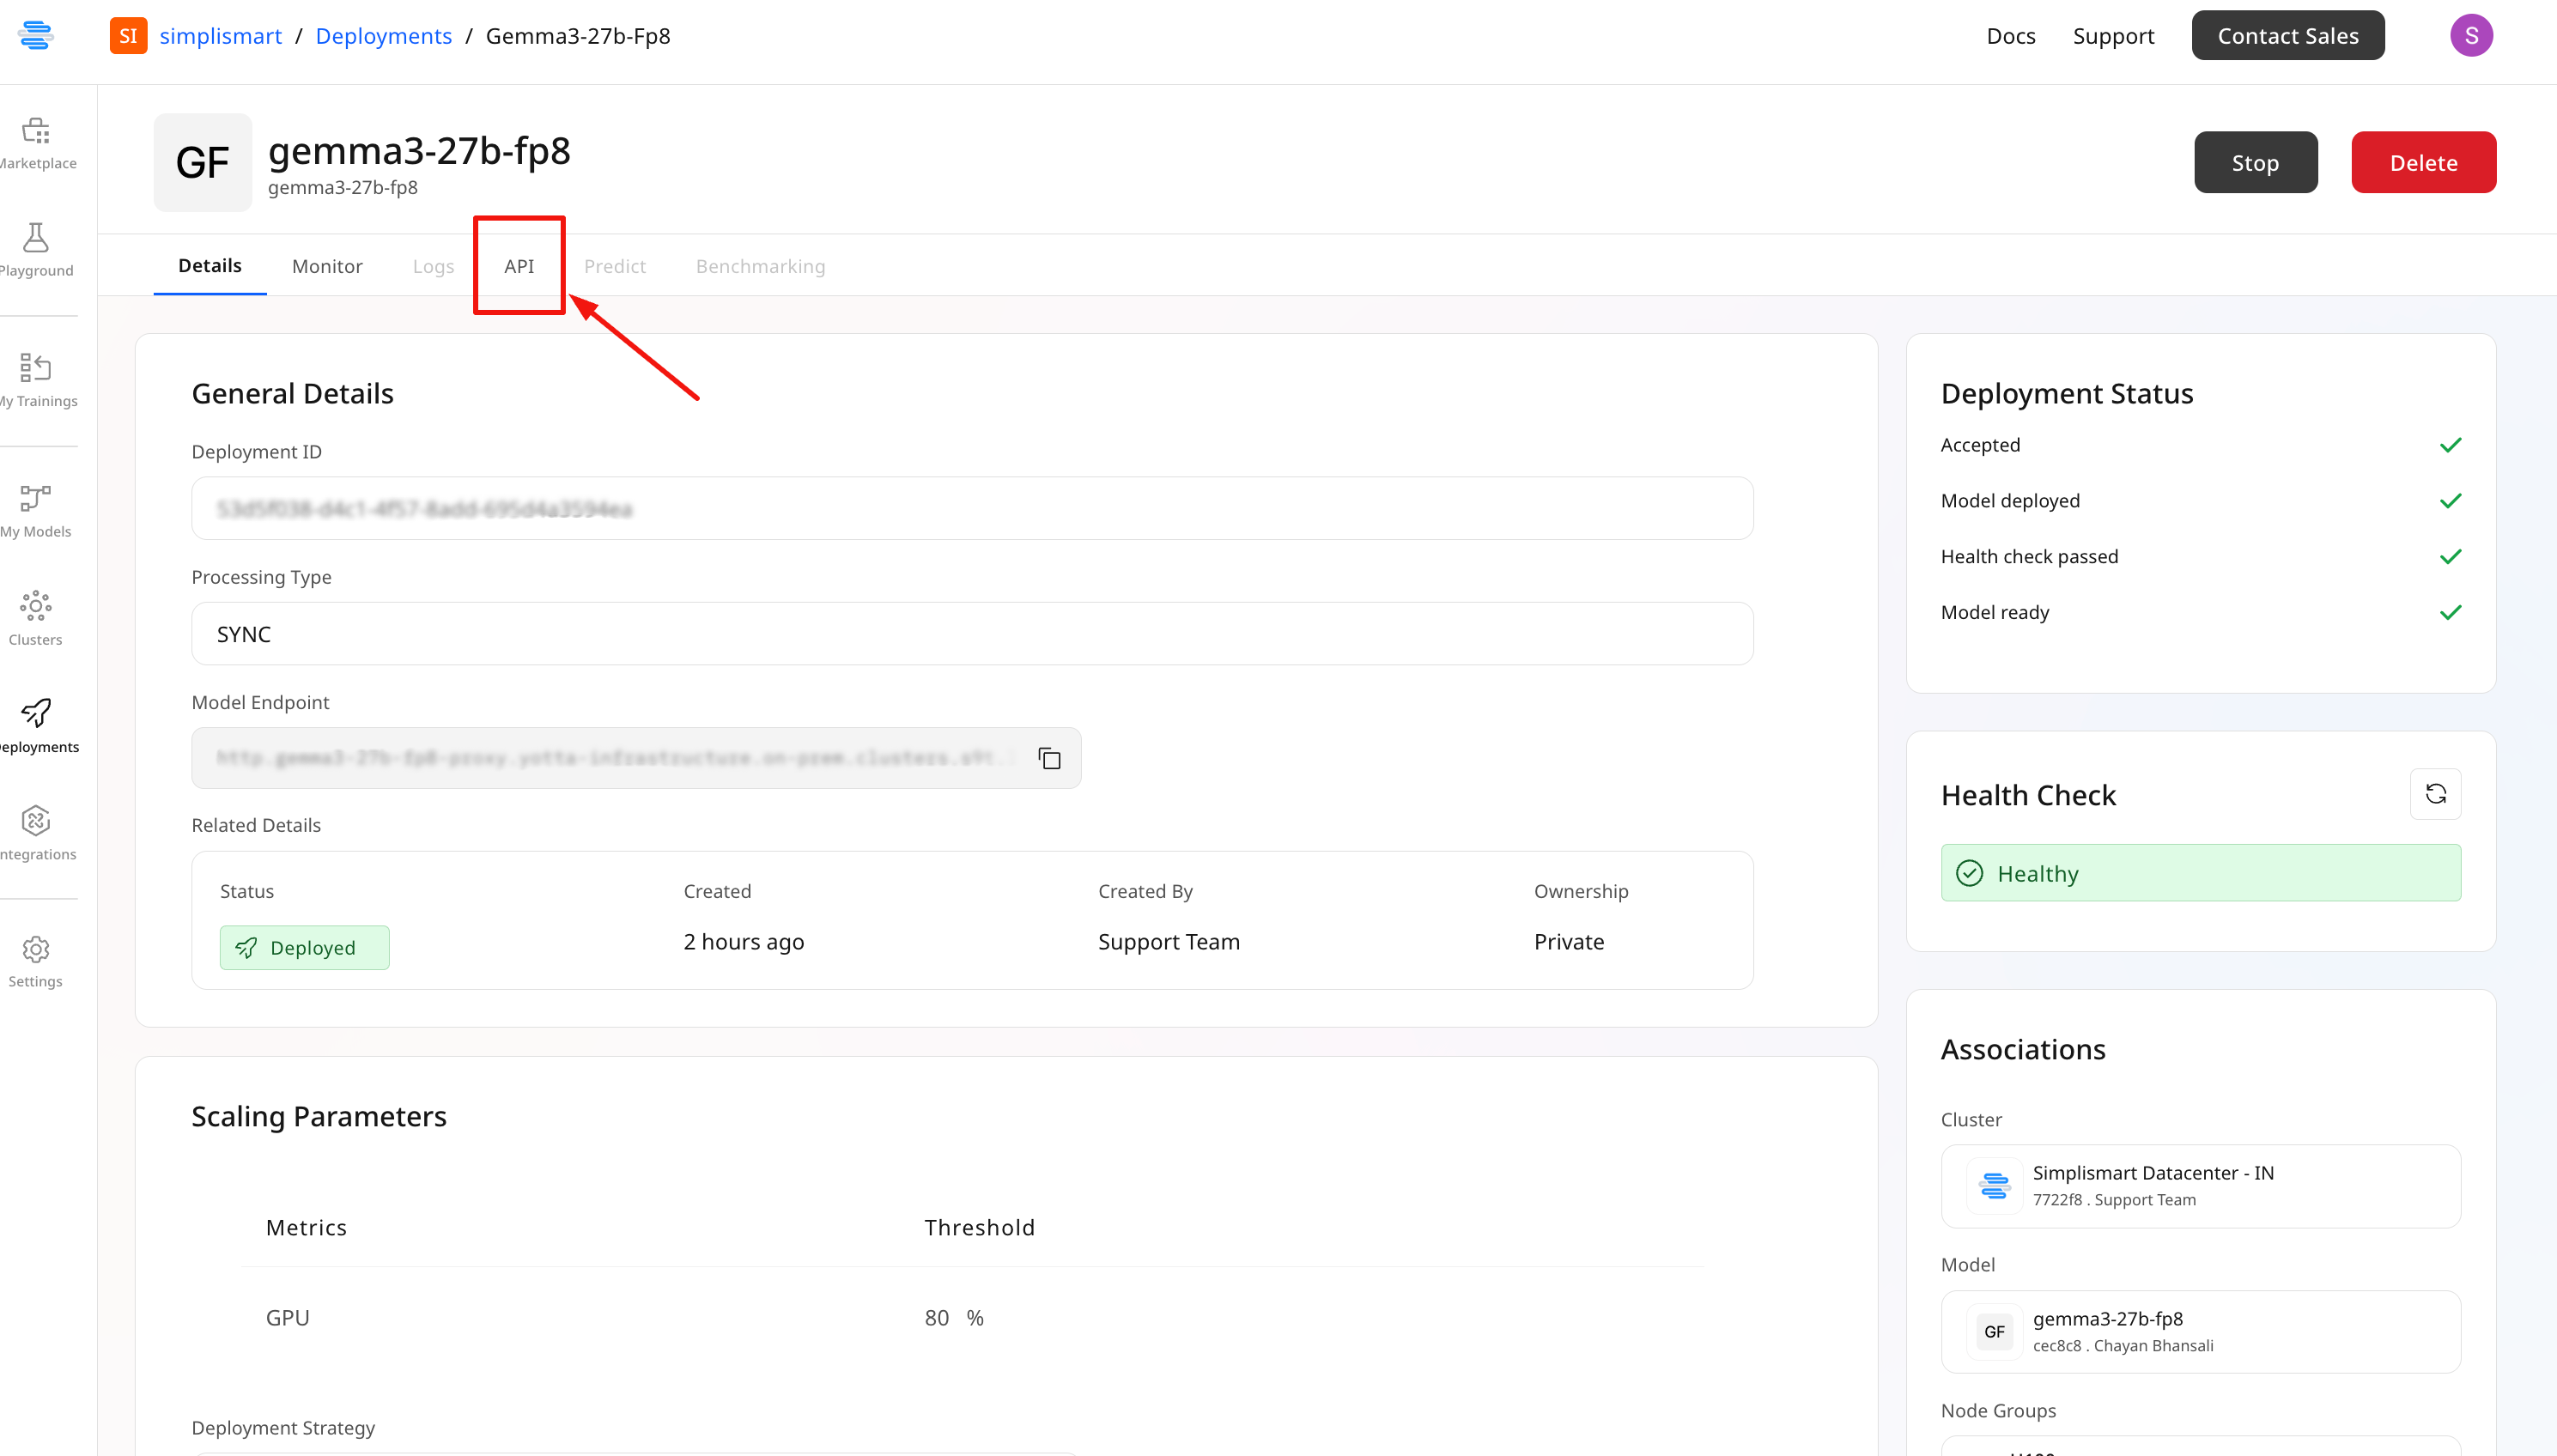
Once the model is successfully deployed, you can follow these steps to begin inference:
Go to the
API
tab of your model
Find the
Endpoint URL
and the pre-generated inference script
Copy the script, replace placeholder values, and execute it to call the model
How to access your API Key?
Go to
Account Settings
and select
API Key
The Monitor tab provides an overview of your deployment’s performance.
Monitor Real-Time Status:
Pod Info:
Status and count of active pods
Throughput & Latency:
Requests per second and processing time
Success & Failure Rates:
Percentage of successful and failed inferences
2. Resource Monitoring
: Various system level metrics can be tracked along with system load information; such as CPU/ GPU usage & request metrics.
Deploy on an Imported Cluster
Benchmarking
Assistant
Responses are generated using AI and may contain mistakes.