> ## Documentation Index
> Fetch the complete documentation index at: https://docs.simplismart.ai/llms.txt
> Use this file to discover all available pages before exploring further.

# Usage

> This page helps you track your usage across all deployments

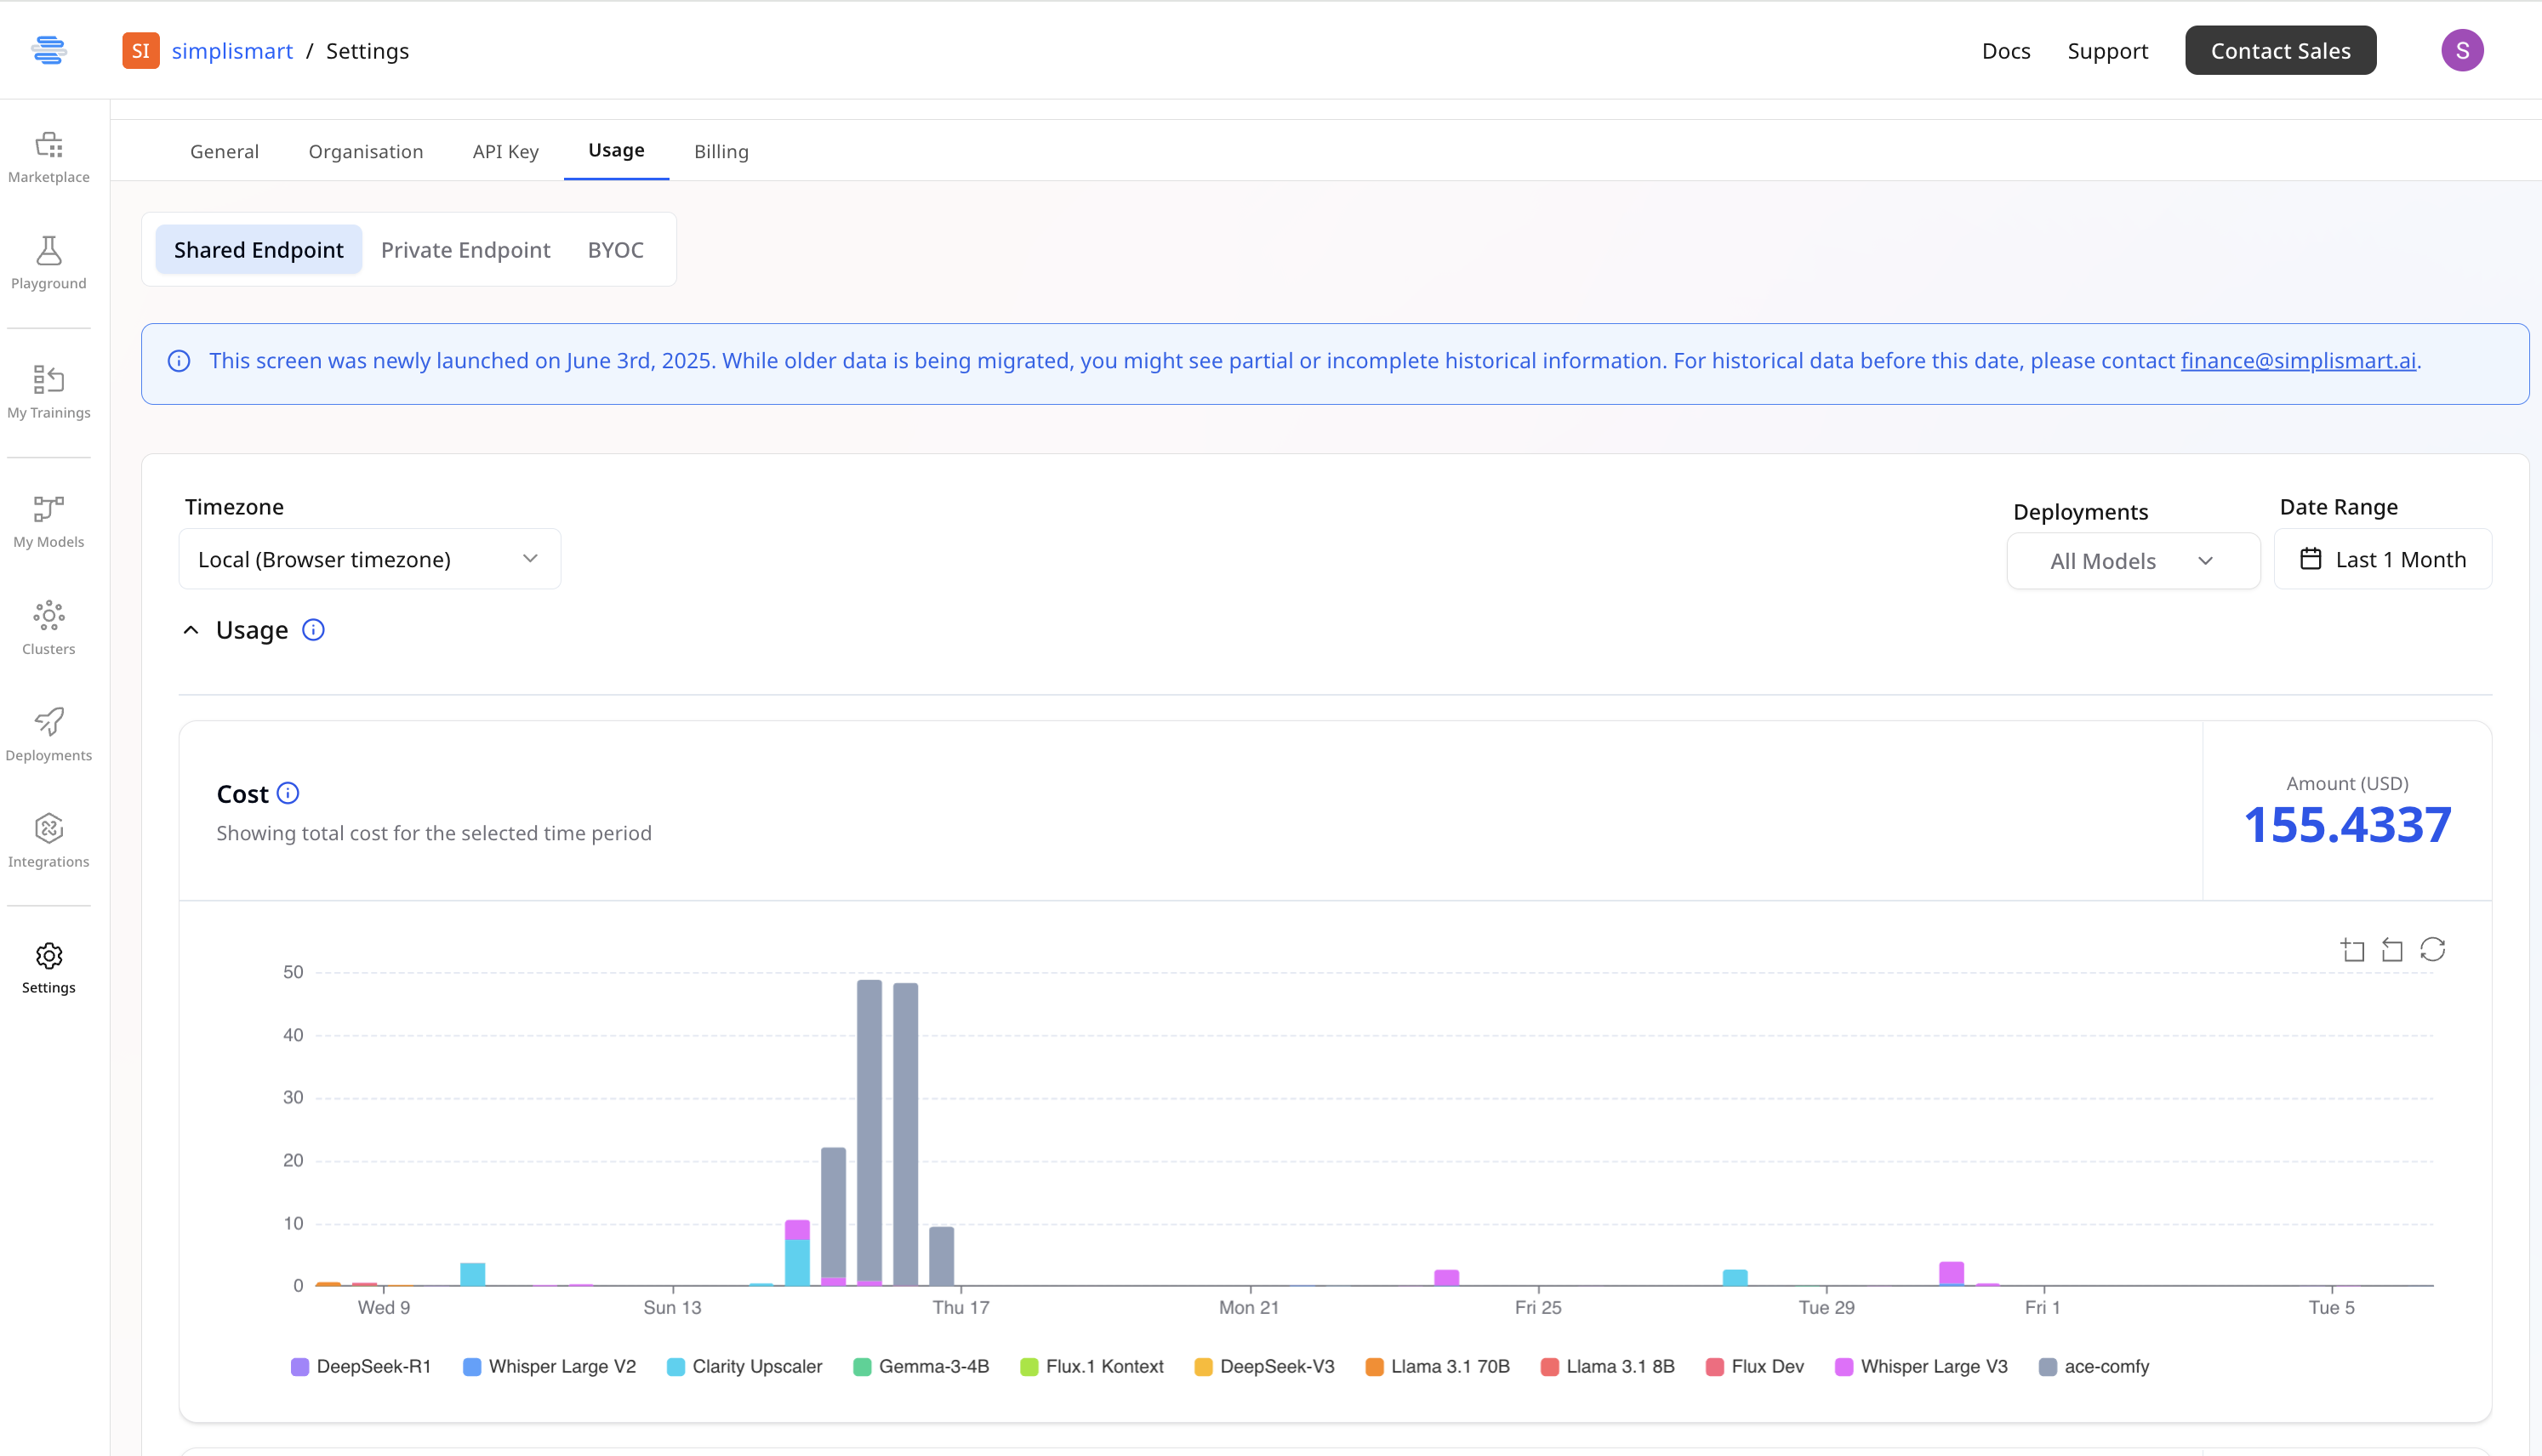
The Usage Board provides a comprehensive view of your total usage for all your deployments.

## **Review Usage Overview**

* The board displays total usage data for the chosen date range for all your deployments.
<img src="https://mintcdn.com/simplismart-3f10d72e/gTRCmRuan7ftye2b/images/Screenshot2025-08-07at3.26.22PM.png?fit=max&auto=format&n=gTRCmRuan7ftye2b&q=85&s=8b48dae6f801380ff7ea224a6415c1c3" alt="Screenshot 2025-08-07 at 3.26.22 PM.png" width="2988" height="1712" data-path="images/Screenshot2025-08-07at3.26.22PM.png" />

***

## **Access Detailed Request Logs**

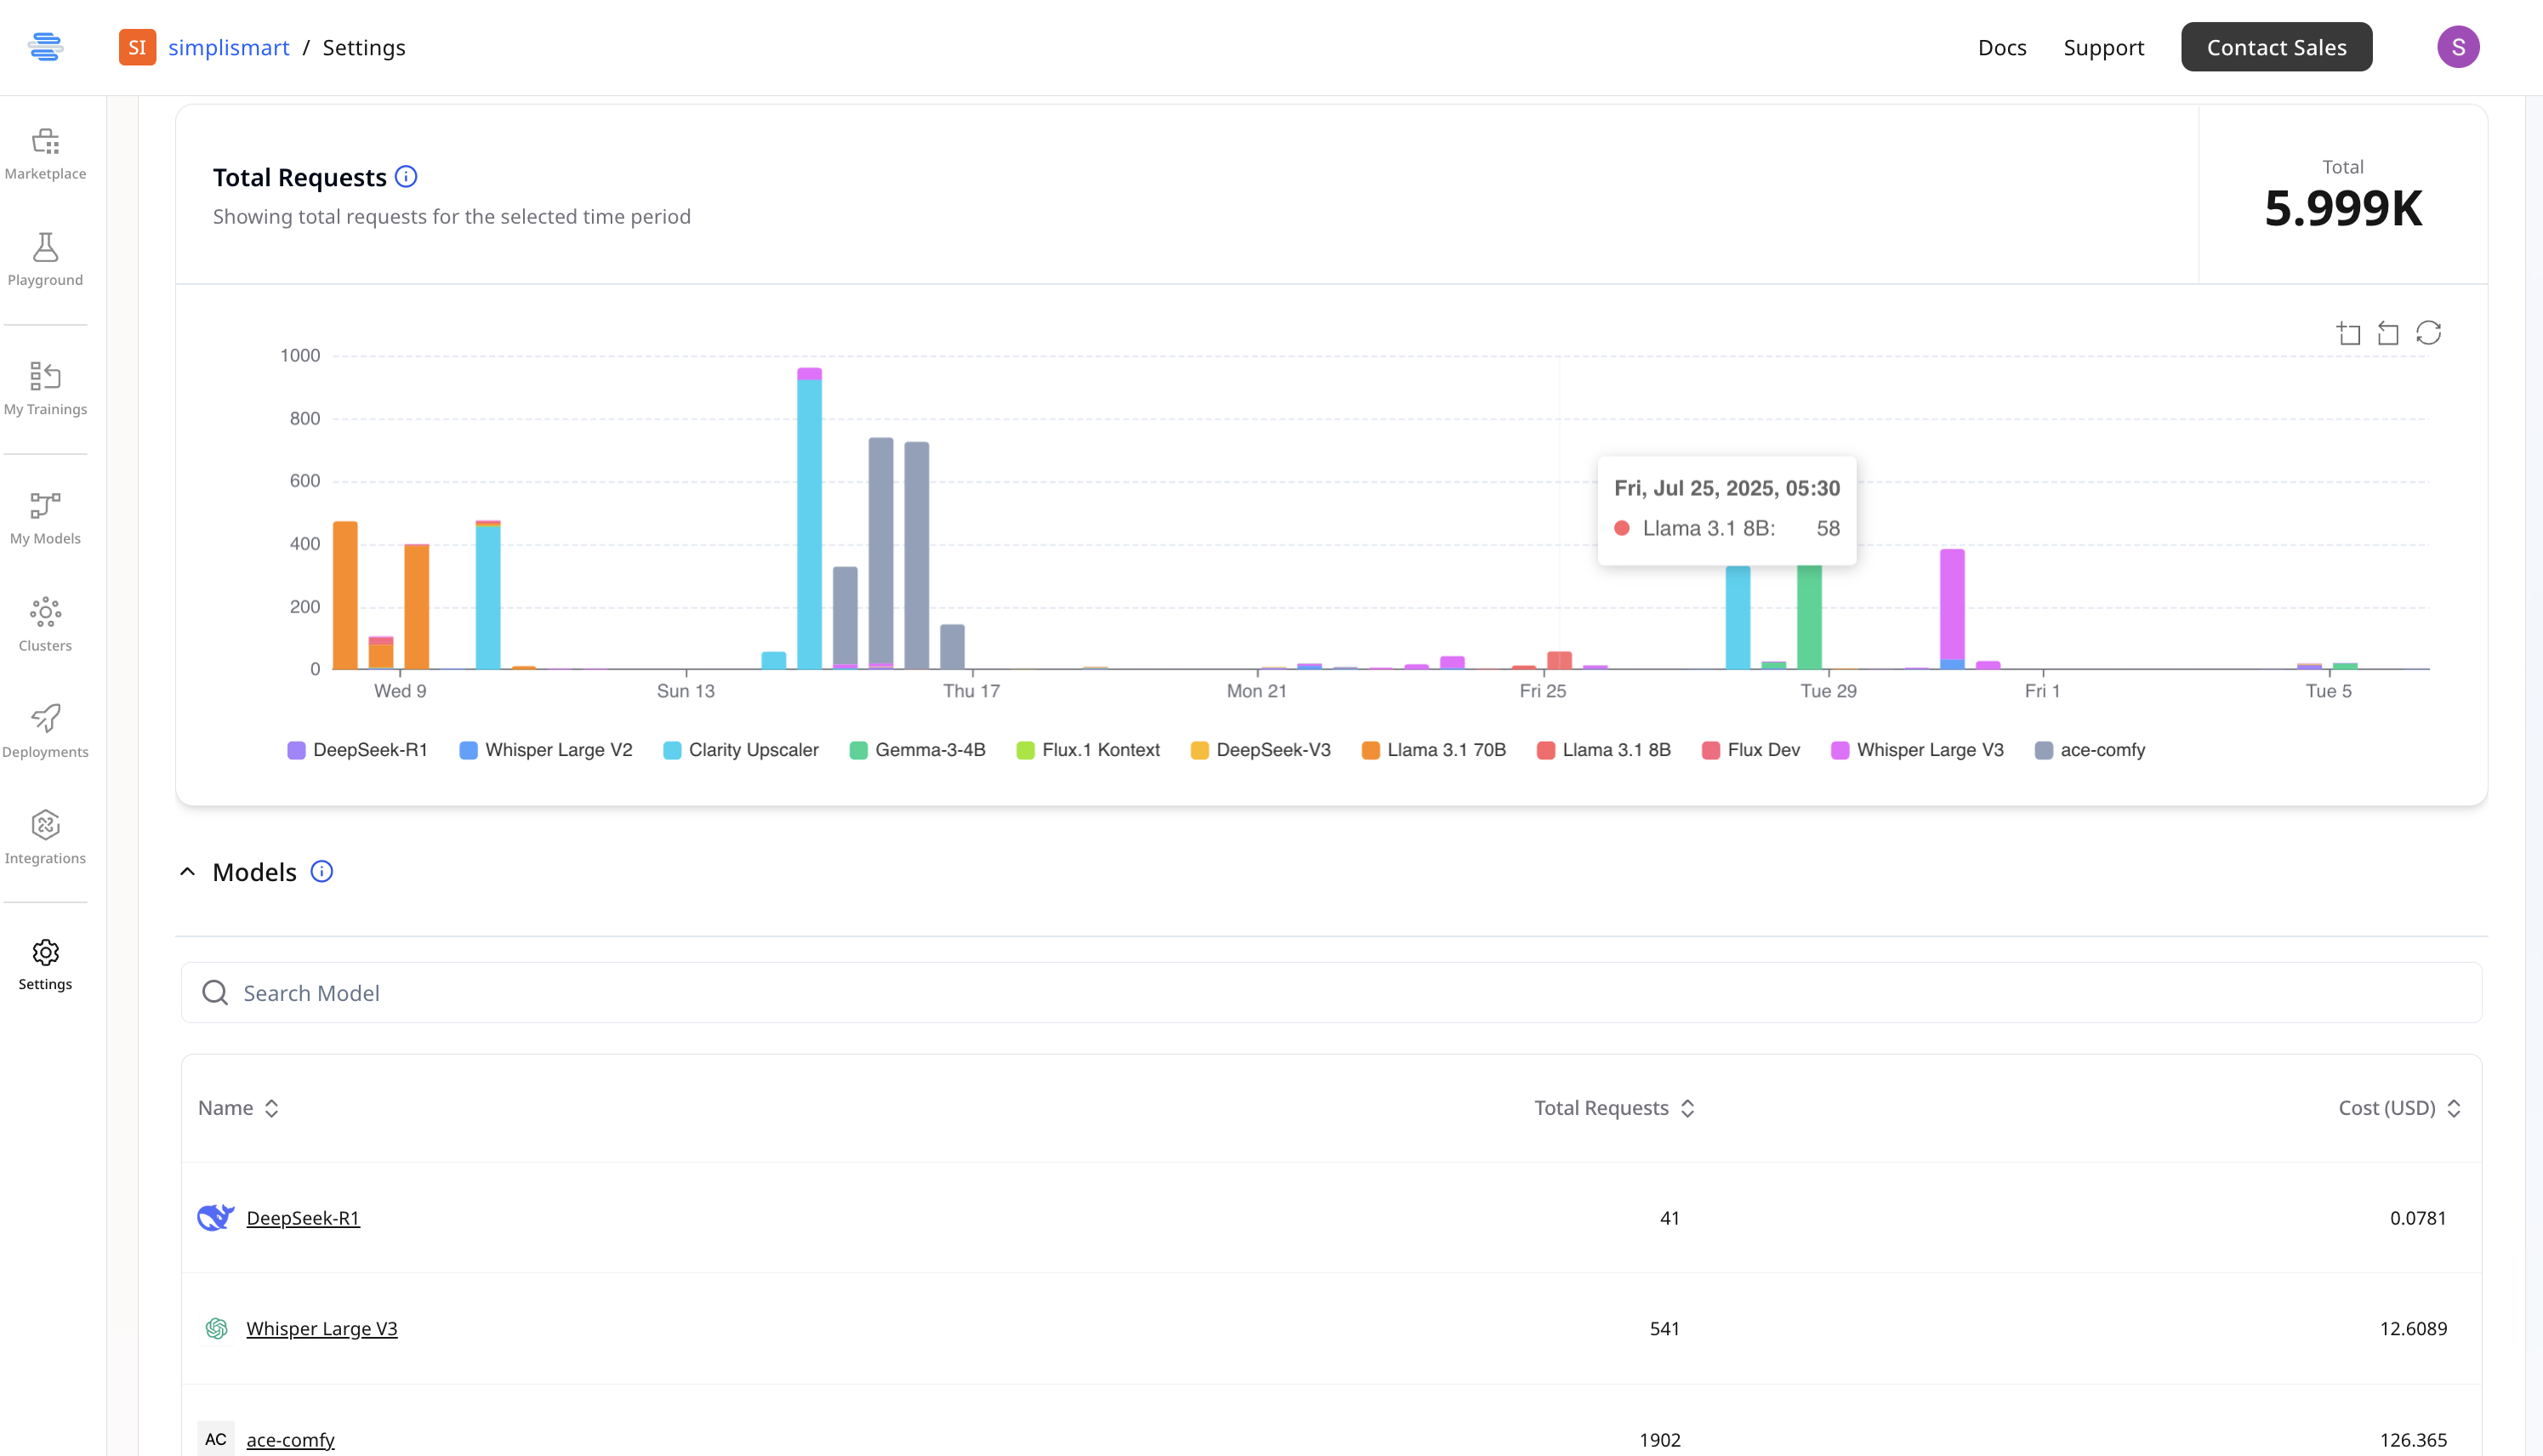
* You will also be able to see the request count in the same time frame
<img src="https://mintcdn.com/simplismart-3f10d72e/gTRCmRuan7ftye2b/images/Screenshot2025-08-07at3.27.44PM.png?fit=max&auto=format&n=gTRCmRuan7ftye2b&q=85&s=756b82713aba32ff8969ffd6d055b5d2" alt="Screenshot 2025-08-07 at 3.27.44 PM.png" width="2990" height="1712" data-path="images/Screenshot2025-08-07at3.27.44PM.png" />

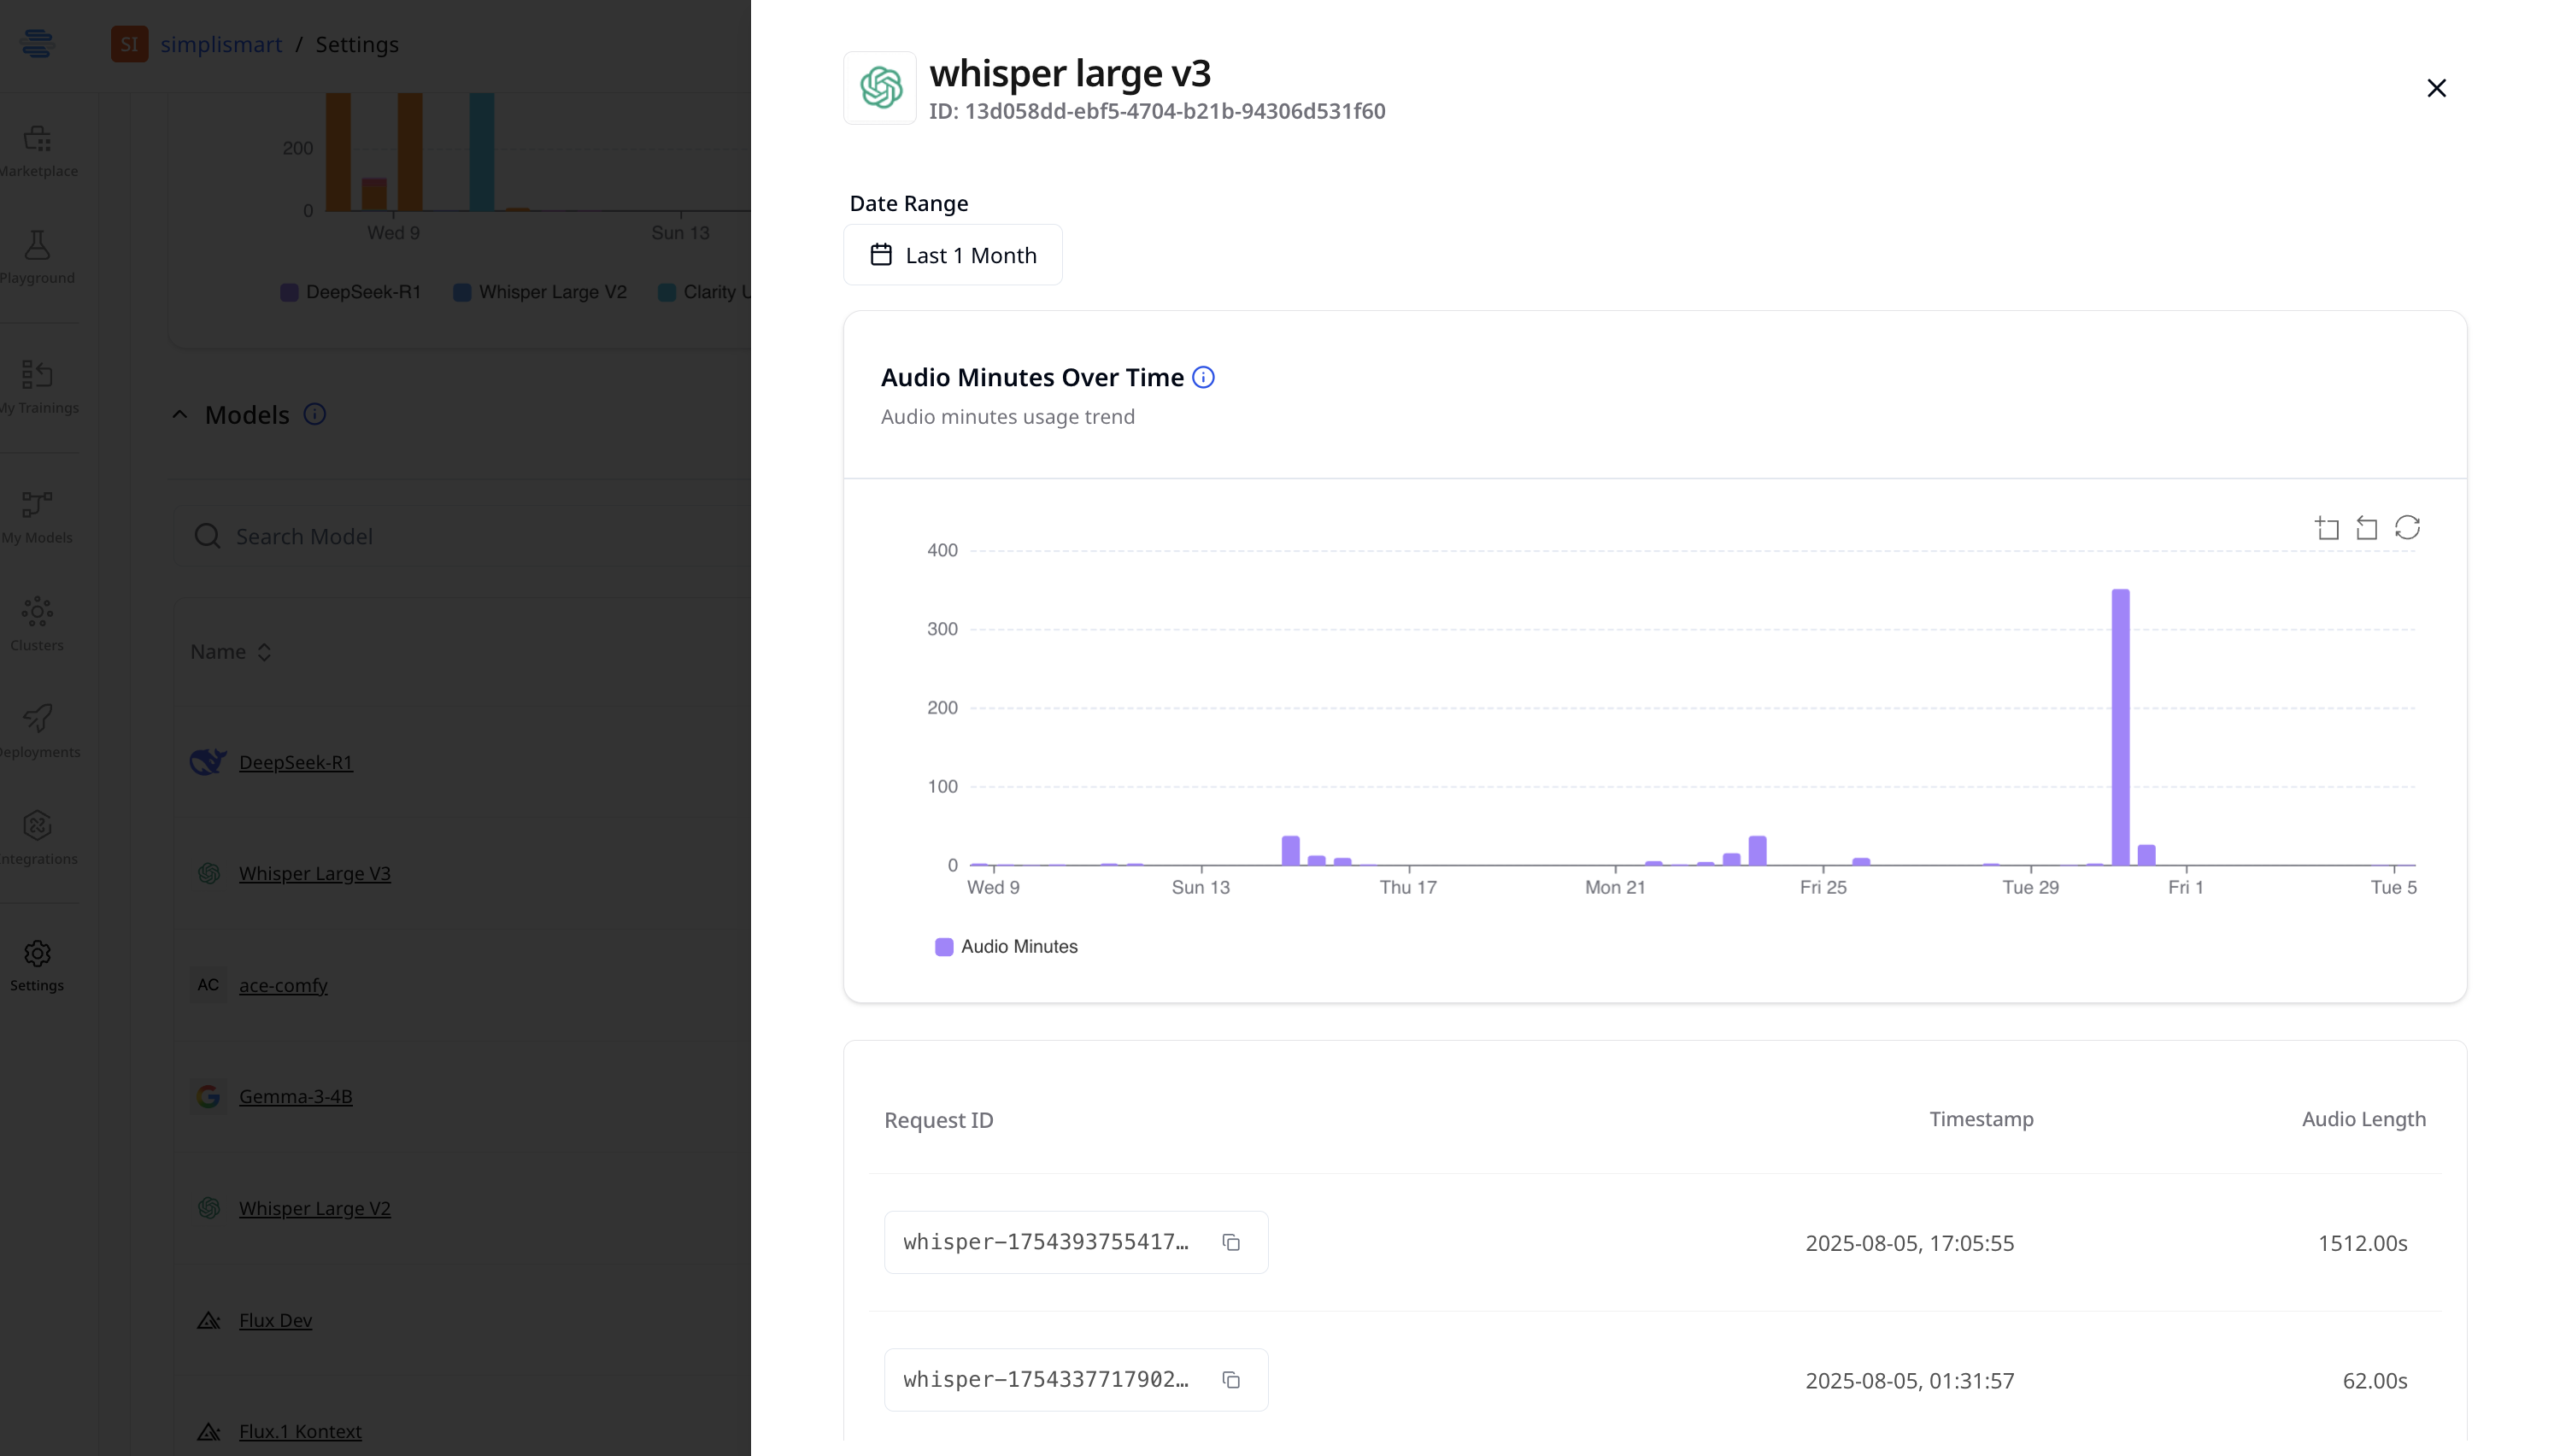
* For more details, click on a specific model.
* This will then give information regarding each request with the associated timeline.
<img src="https://mintcdn.com/simplismart-3f10d72e/gTRCmRuan7ftye2b/images/Screenshot2025-08-07at3.29.13PM.png?fit=max&auto=format&n=gTRCmRuan7ftye2b&q=85&s=c5f4ca2eeb22426a54293b8a51dd926c" alt="Screenshot 2025-08-07 at 3.29.13 PM.png" width="2996" height="1704" data-path="images/Screenshot2025-08-07at3.29.13PM.png" />

***

## **Group By: Deployment or GPU**

On the Private Endpoint usage tab, use the **Group By** dropdown to switch how cost is broken down:

* **Deployment** — cost per individual deployment, same as the default view above.
* **GPU** — cost per accelerator/GPU type, pooled across all deployments on that GPU type.

## **Reservation Commitment (Reserved plan orgs)**

For orgs on a reservation/commitment billing plan, the cost chart also breaks out how usage reconciles against the committed capacity:

* **Reserved** — cost covered by (utilized within) the committed capacity.
* **Reserved not util** — committed capacity paid for but not used in that window.
* **On-demand overage** — usage billed above the committed quantity.

The displayed total cost reflects the real, commitment-adjusted amount rather than a plain metered sum.
